3.6 Data Lab
The Data Lab is a module that allows you to perform a quantitative analysis of pre-selected data. You can analyze data by providing nodes from either an Exploration Session or Sandbox Session. However, please note that data created in a Sandbox, such as created nodes, cannot be transferred to the Data Lab.
Providing Data to the Data Lab
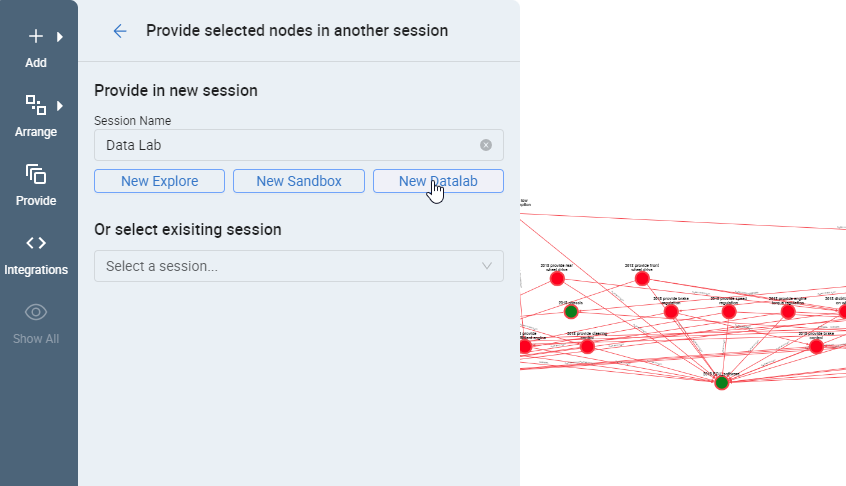
To analyze data in the Data Lab the user has to provide data to it. Therefore follow the steps below:
- Select the nodes you want to analyze in the Exploration Session or Sandbox Session.
- Open the Provide feature on the left side menu.
- Optional you can set a name for the Data Lab, then confirm the creation with New Data Lab.
Data Lab Overview
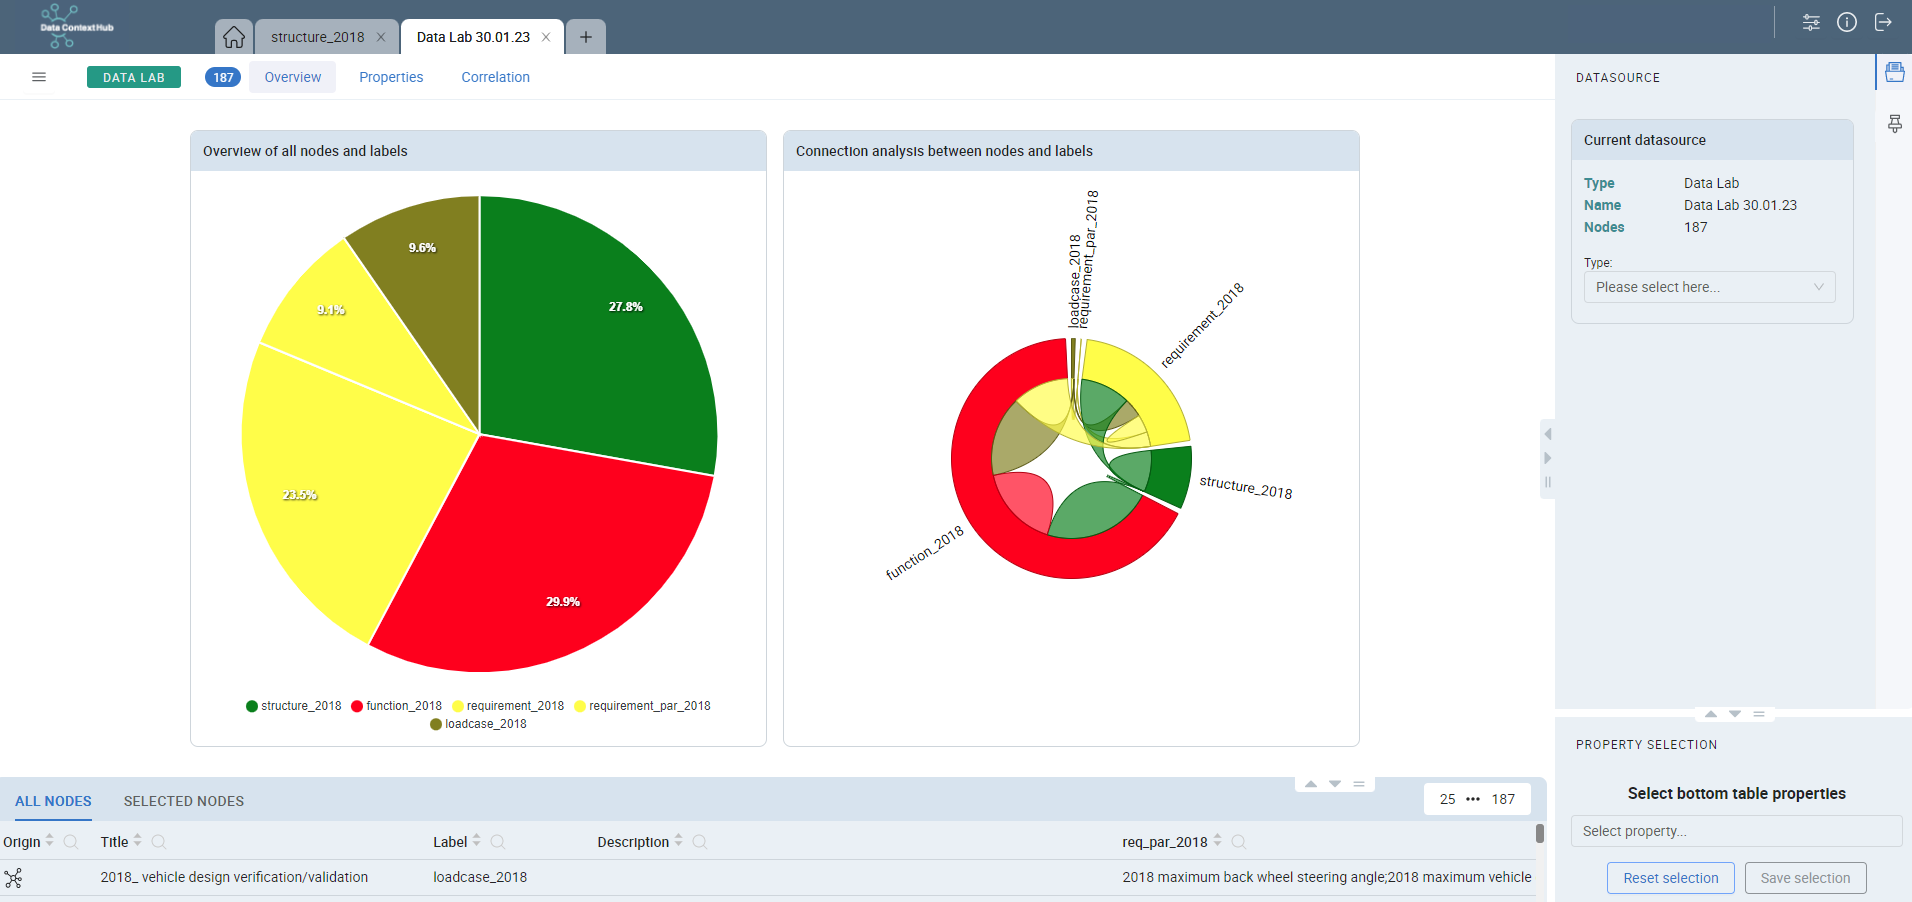
In the Data Lab Overview, you can view the distribution of nodes between entities. The top left corner contains a menu where you can save or export (template needed) the Data Lab.
On the right side, you can find information about the Data Lab and the number of nodes. To switch to another data set you can also select another Session, Data Lab or Sandbox in the dropdown on this menu on the right side. In the Bottom Panel the user can view the properties of the nodes similar to the Exploration Session.
In the upper menu there are three buttons: Overview, Properties, Correlation. These let the user navigate to the different analyzation features of the Data Lab.
Property Analysis
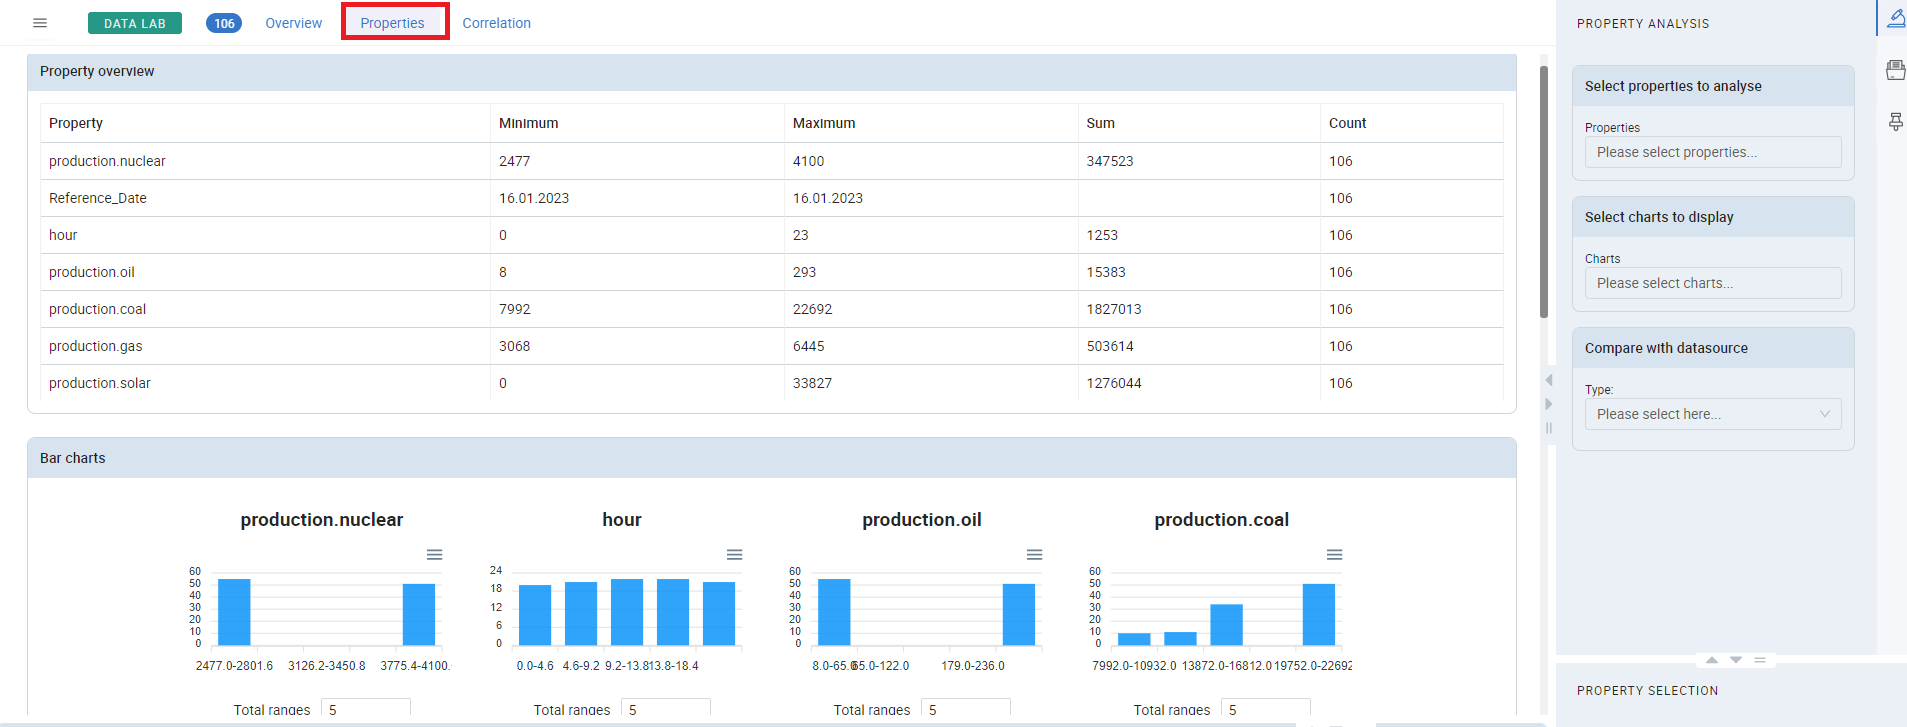
In the Properties analysis, you can view a quantitative analysis of the node values you have selected. You can choose from different chart types for visualization and select different properties to analyze or compare with other data sources from the right menu.
Property Correlation
In the Correlation tab, you can correlate values from an entity. To do this, you need to select a property for the x-axis and the y-axis from the right menu. You can also give the correlation a title in the menu.
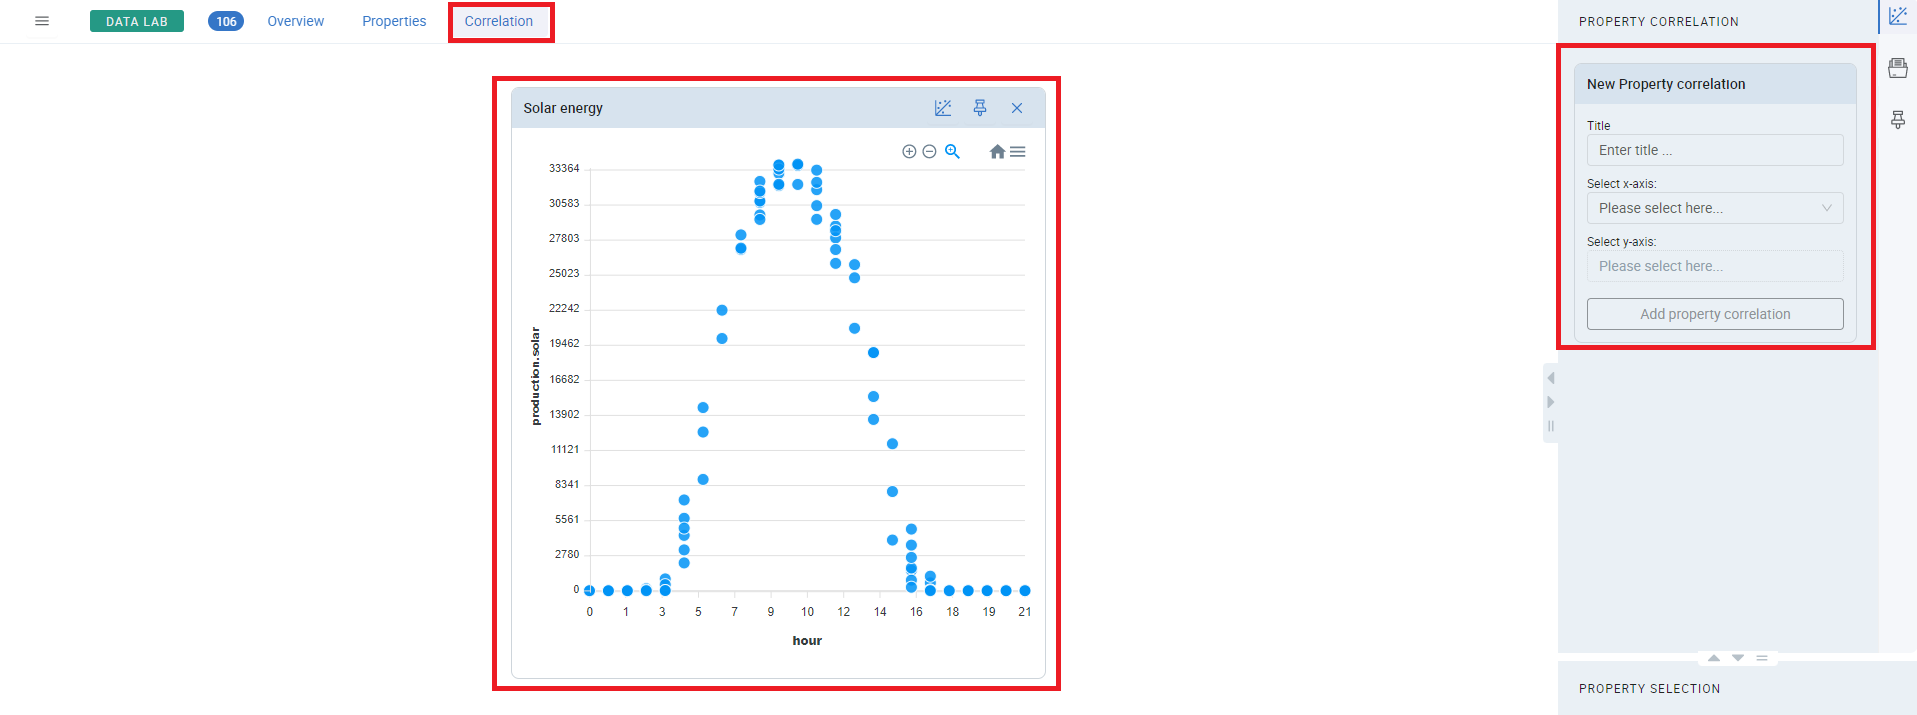
By clicking the Add Property Correlation button, a chart will be displayed in the middle of the window. You can compare multiple y-values with a single x-axis to compare multiple properties over the same value set. You can also add additional correlation charts by repeating the same steps. The chart can be switched between line and dot displays, zoomed in or out, exported, or pinned for future reference.