3.2 Dashboard
The Dashboard serves as the entry point to Explorer and provides a starting screen. From here, you can access an overview of the graph, create new Sessions, load existing Sessions, or open predefined Views.
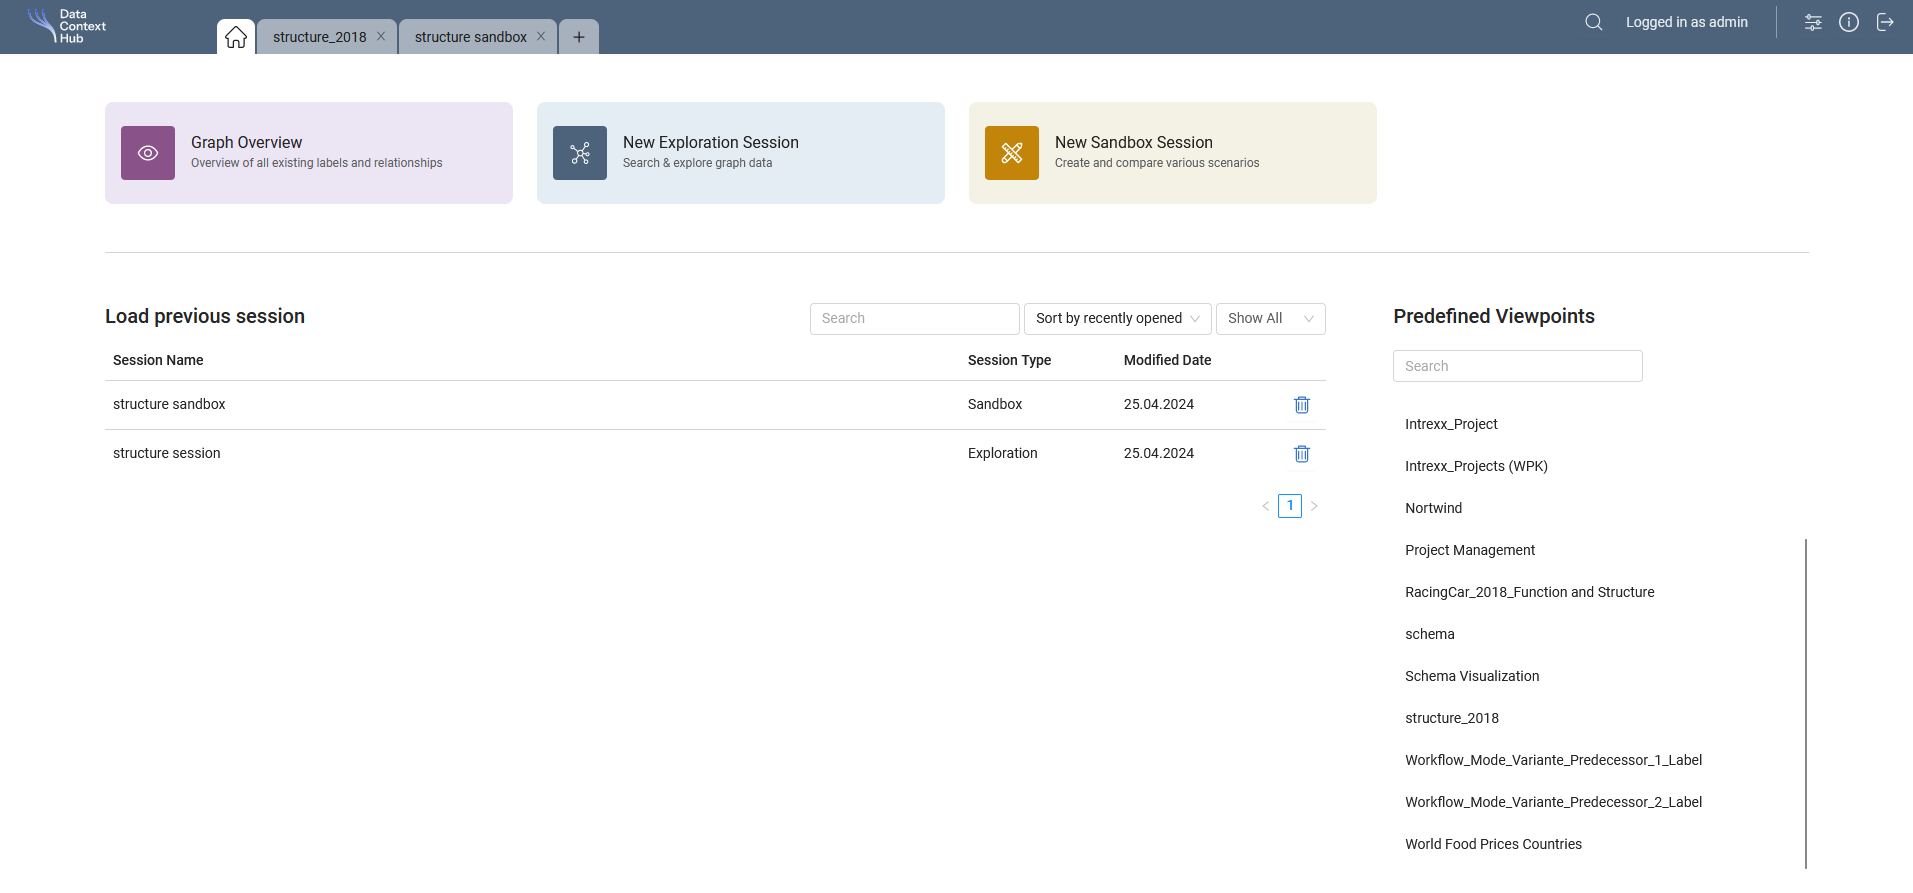
Top Actions
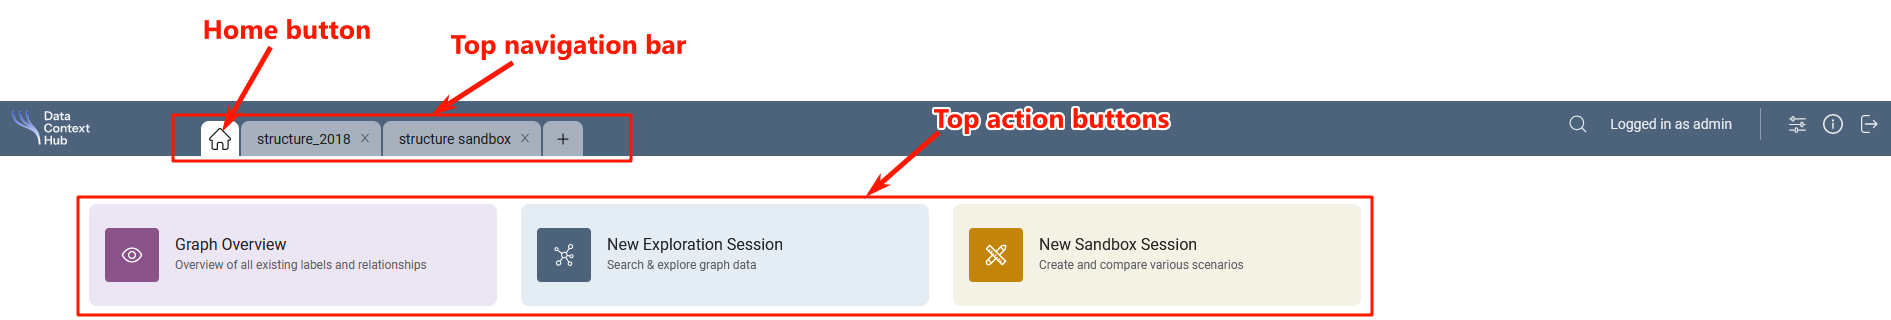
Each new or existing Session will be opened in a new tab, you can navigate between tabs in the Top navigation bar. You can return to the Dashboard by clicking the Home button in the Top navigation bar or the Logo in the top left corner. To log out of the application, press the Logout button in the top right corner.
There are three action buttons that will let you open new Sessions or an overview of the graph.
- Graph overview: Opens an overview of all entities (labels) and their connections in the graph database. If you are new to the application and do not know the content of the database, this is the best way to get an overview of the data in the graph.
- New Exploration Session: Opens a new default Session in Exploration Mode, which is the default mode to explore and analyse the graph data. The session will be empty and you can start by opening the left menu to add nodes. See also Exploration Mode.
- New Sandbox Session: Creates a Sandbox where you can modify existing nodes and relationships or create new ones. The easiest way to add data to a new Sandbox is to select and add the nodes from an existing Exploration Session. See also Sandbox.
Load Previous Session
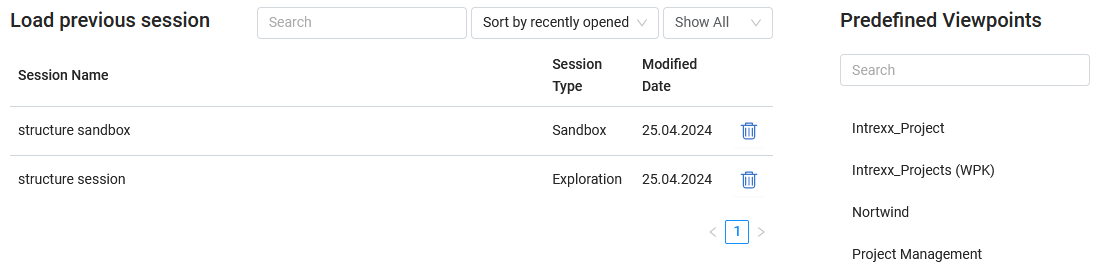
The table shows a list of all previously saved Exploration Sessions and Sandboxes. The list can be searched and filtered by date, name or type of Session. Clicking on a Session entry will open the Session in a new tab.
Predefined Views
Views are a predefined set of nodes and connections with the purpose of providing a starting point for further exploration.