2.3 Dashboard
GBS Dashboard
The GBS Dashboard provides a quick overview over the status in Data Context Hub.
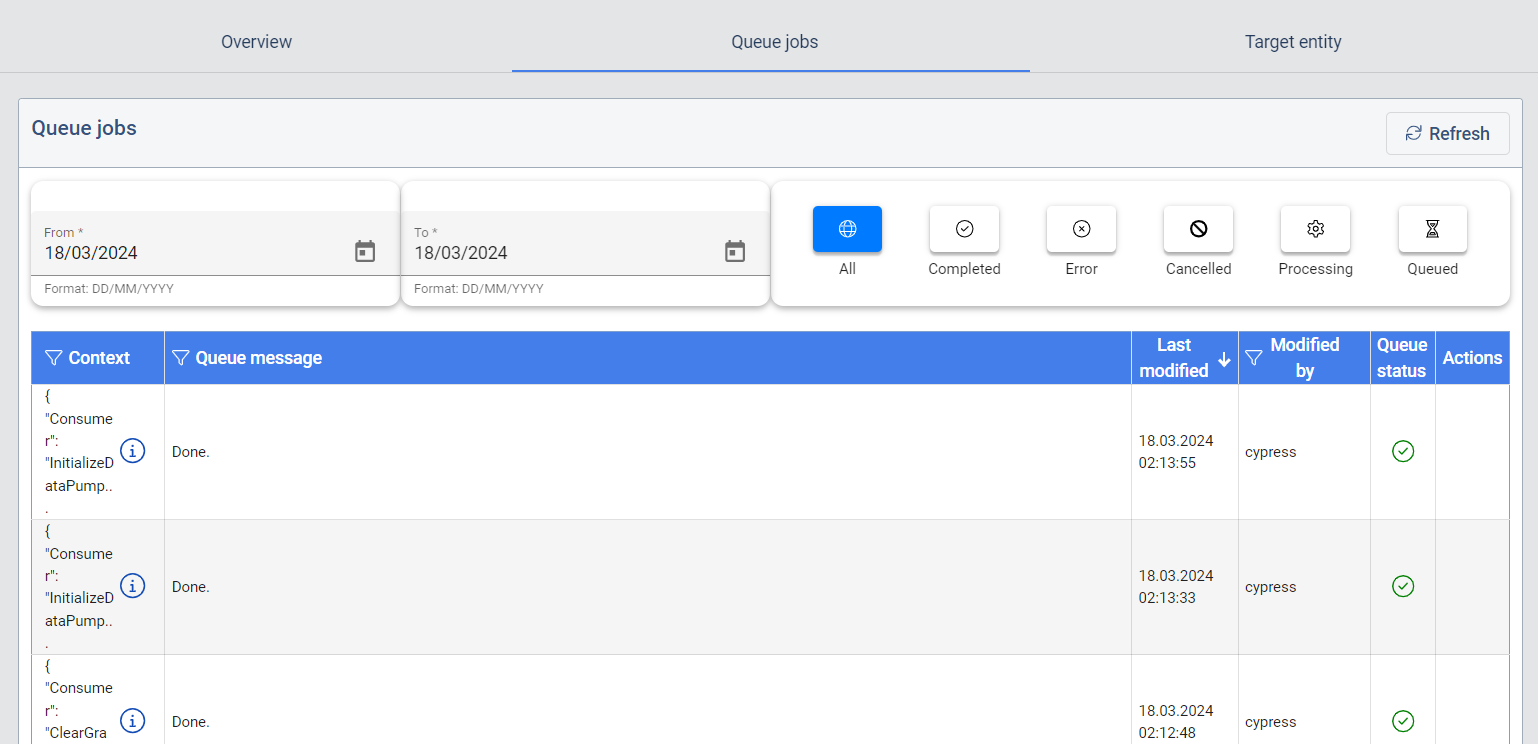
It is also possible to observe the jobs currently running in Data Context Hub via the Queue jobs. This is similar to a task manager in an operating system. This enables the user to see the current load in the system and have more insight in case there are problems in system.
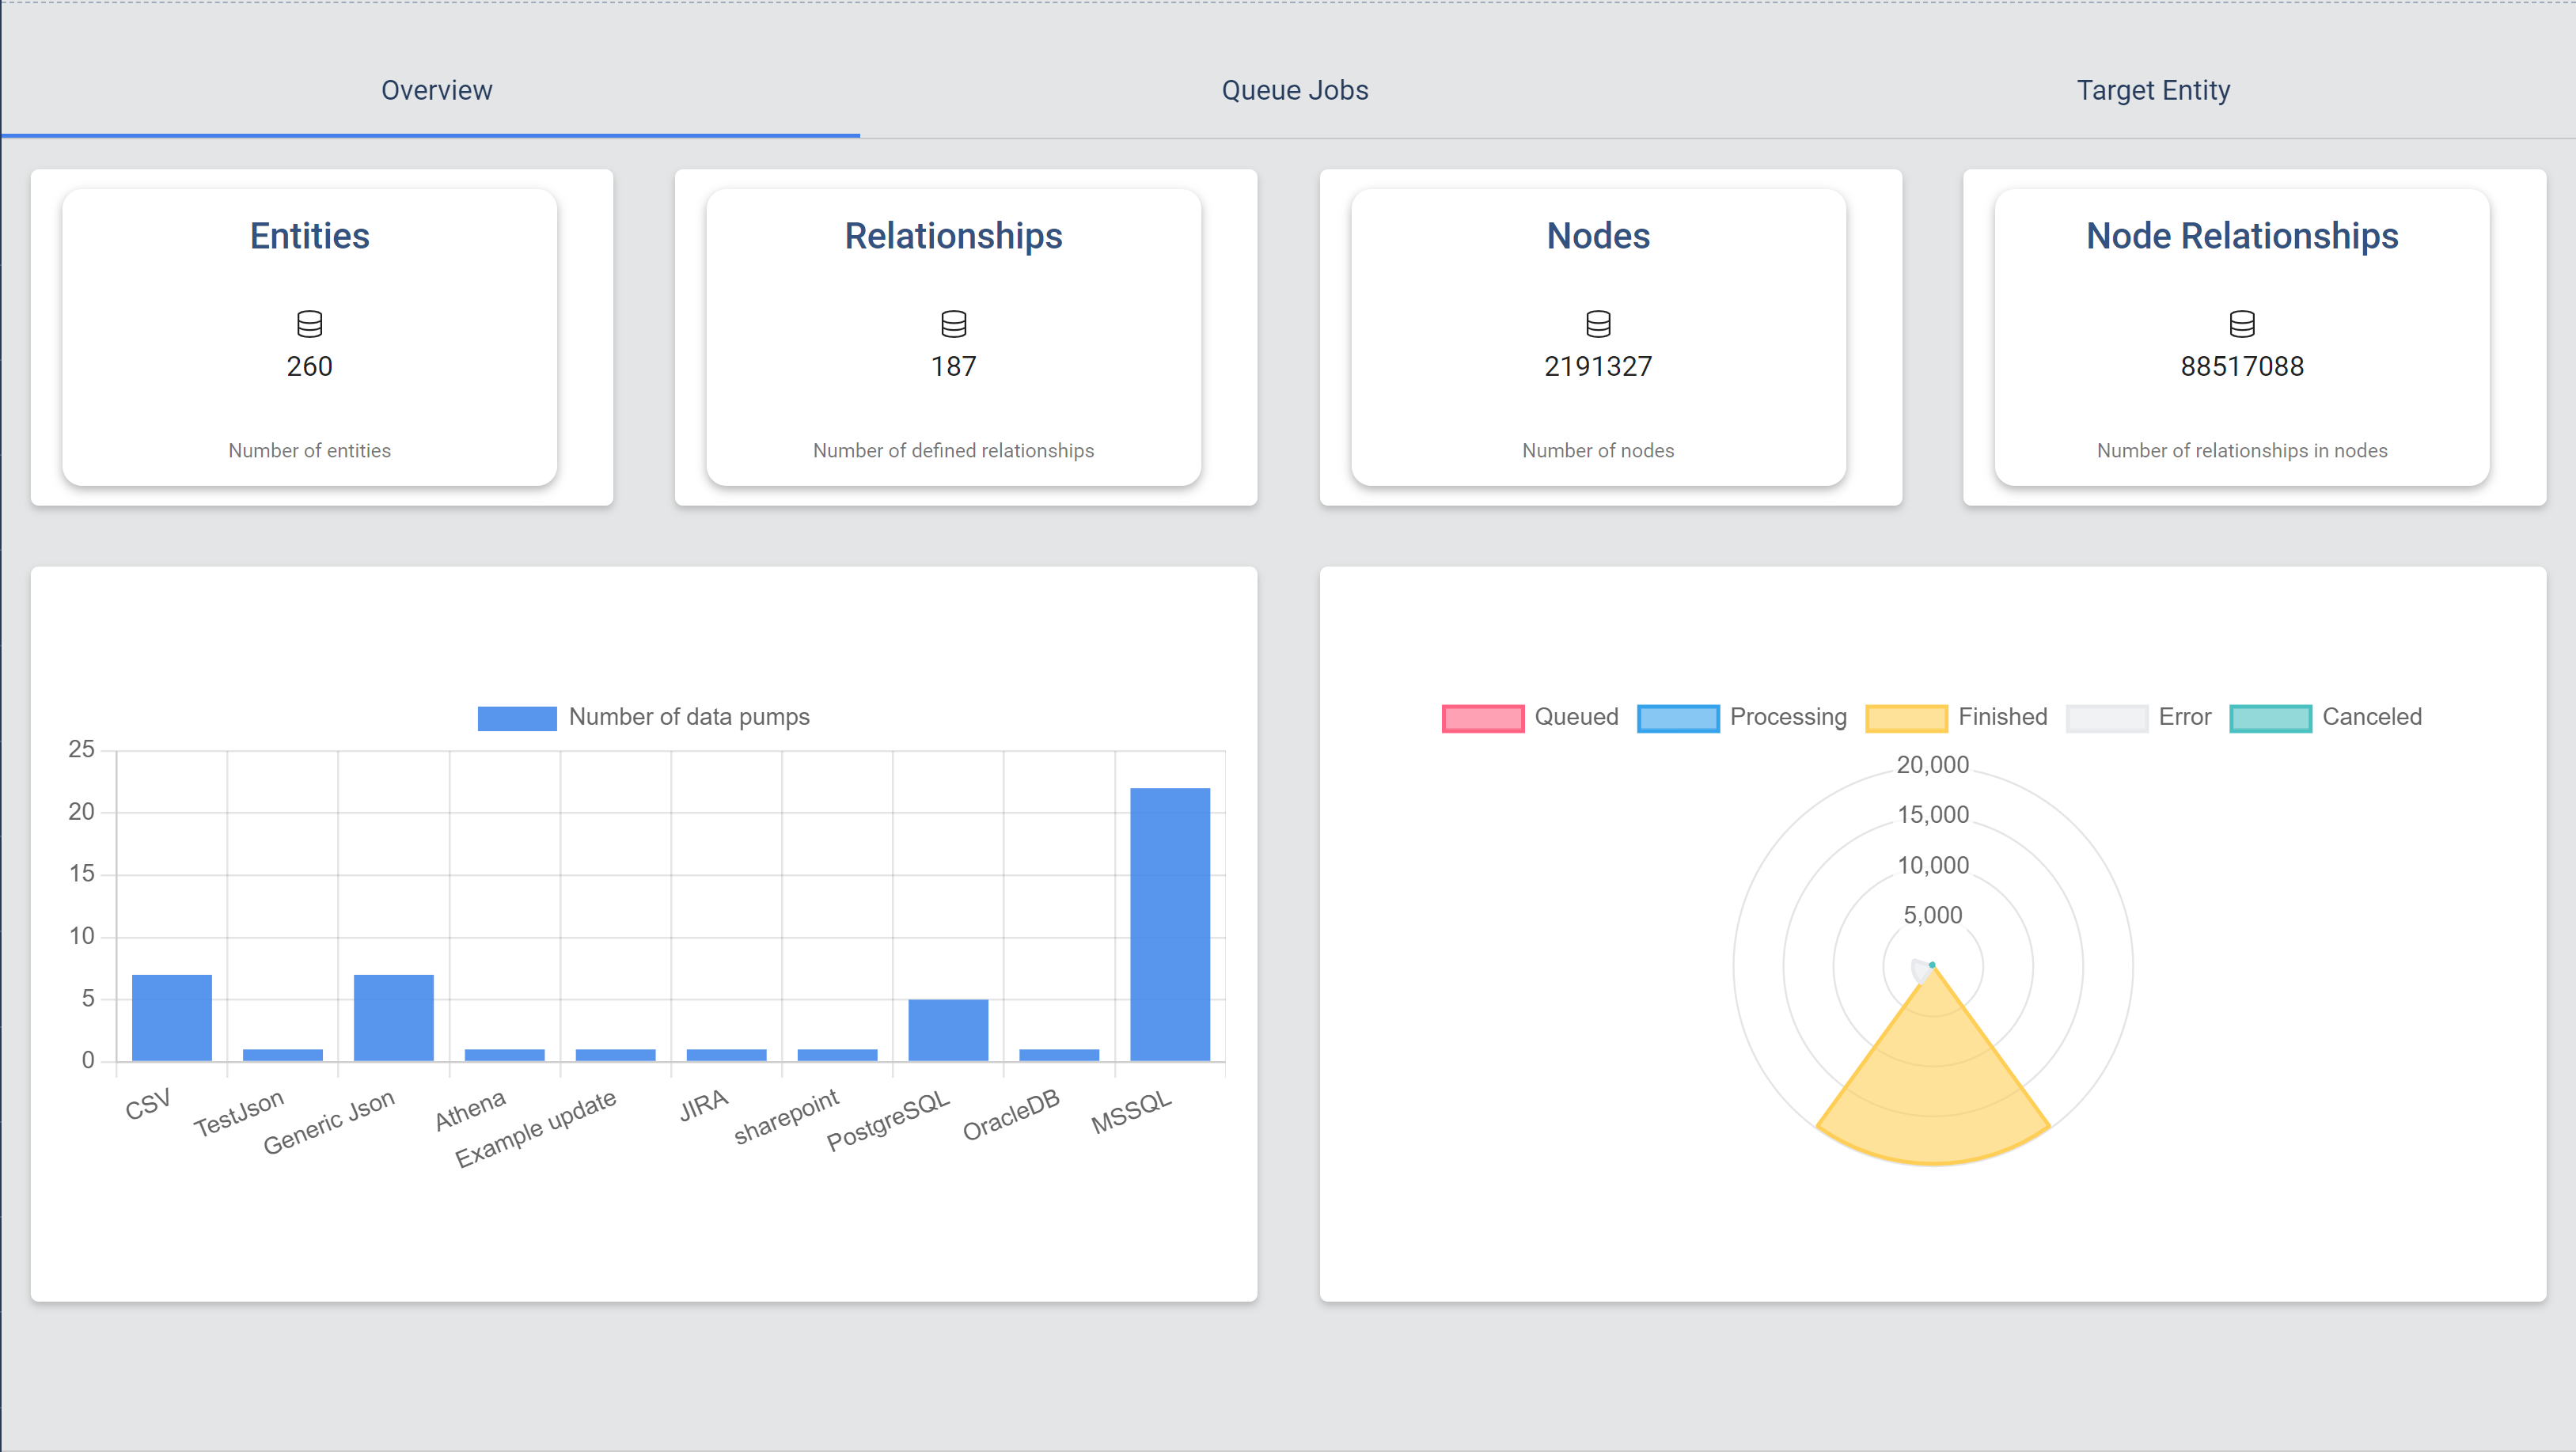
It is also possible to observe the entire overview of Data Context Hub via the Overview. This page provides a rough summary of collective information available at Data Context Hub like number of Entities, Nodes, Relationships, number of Data Pumps, number of Queue jobs.
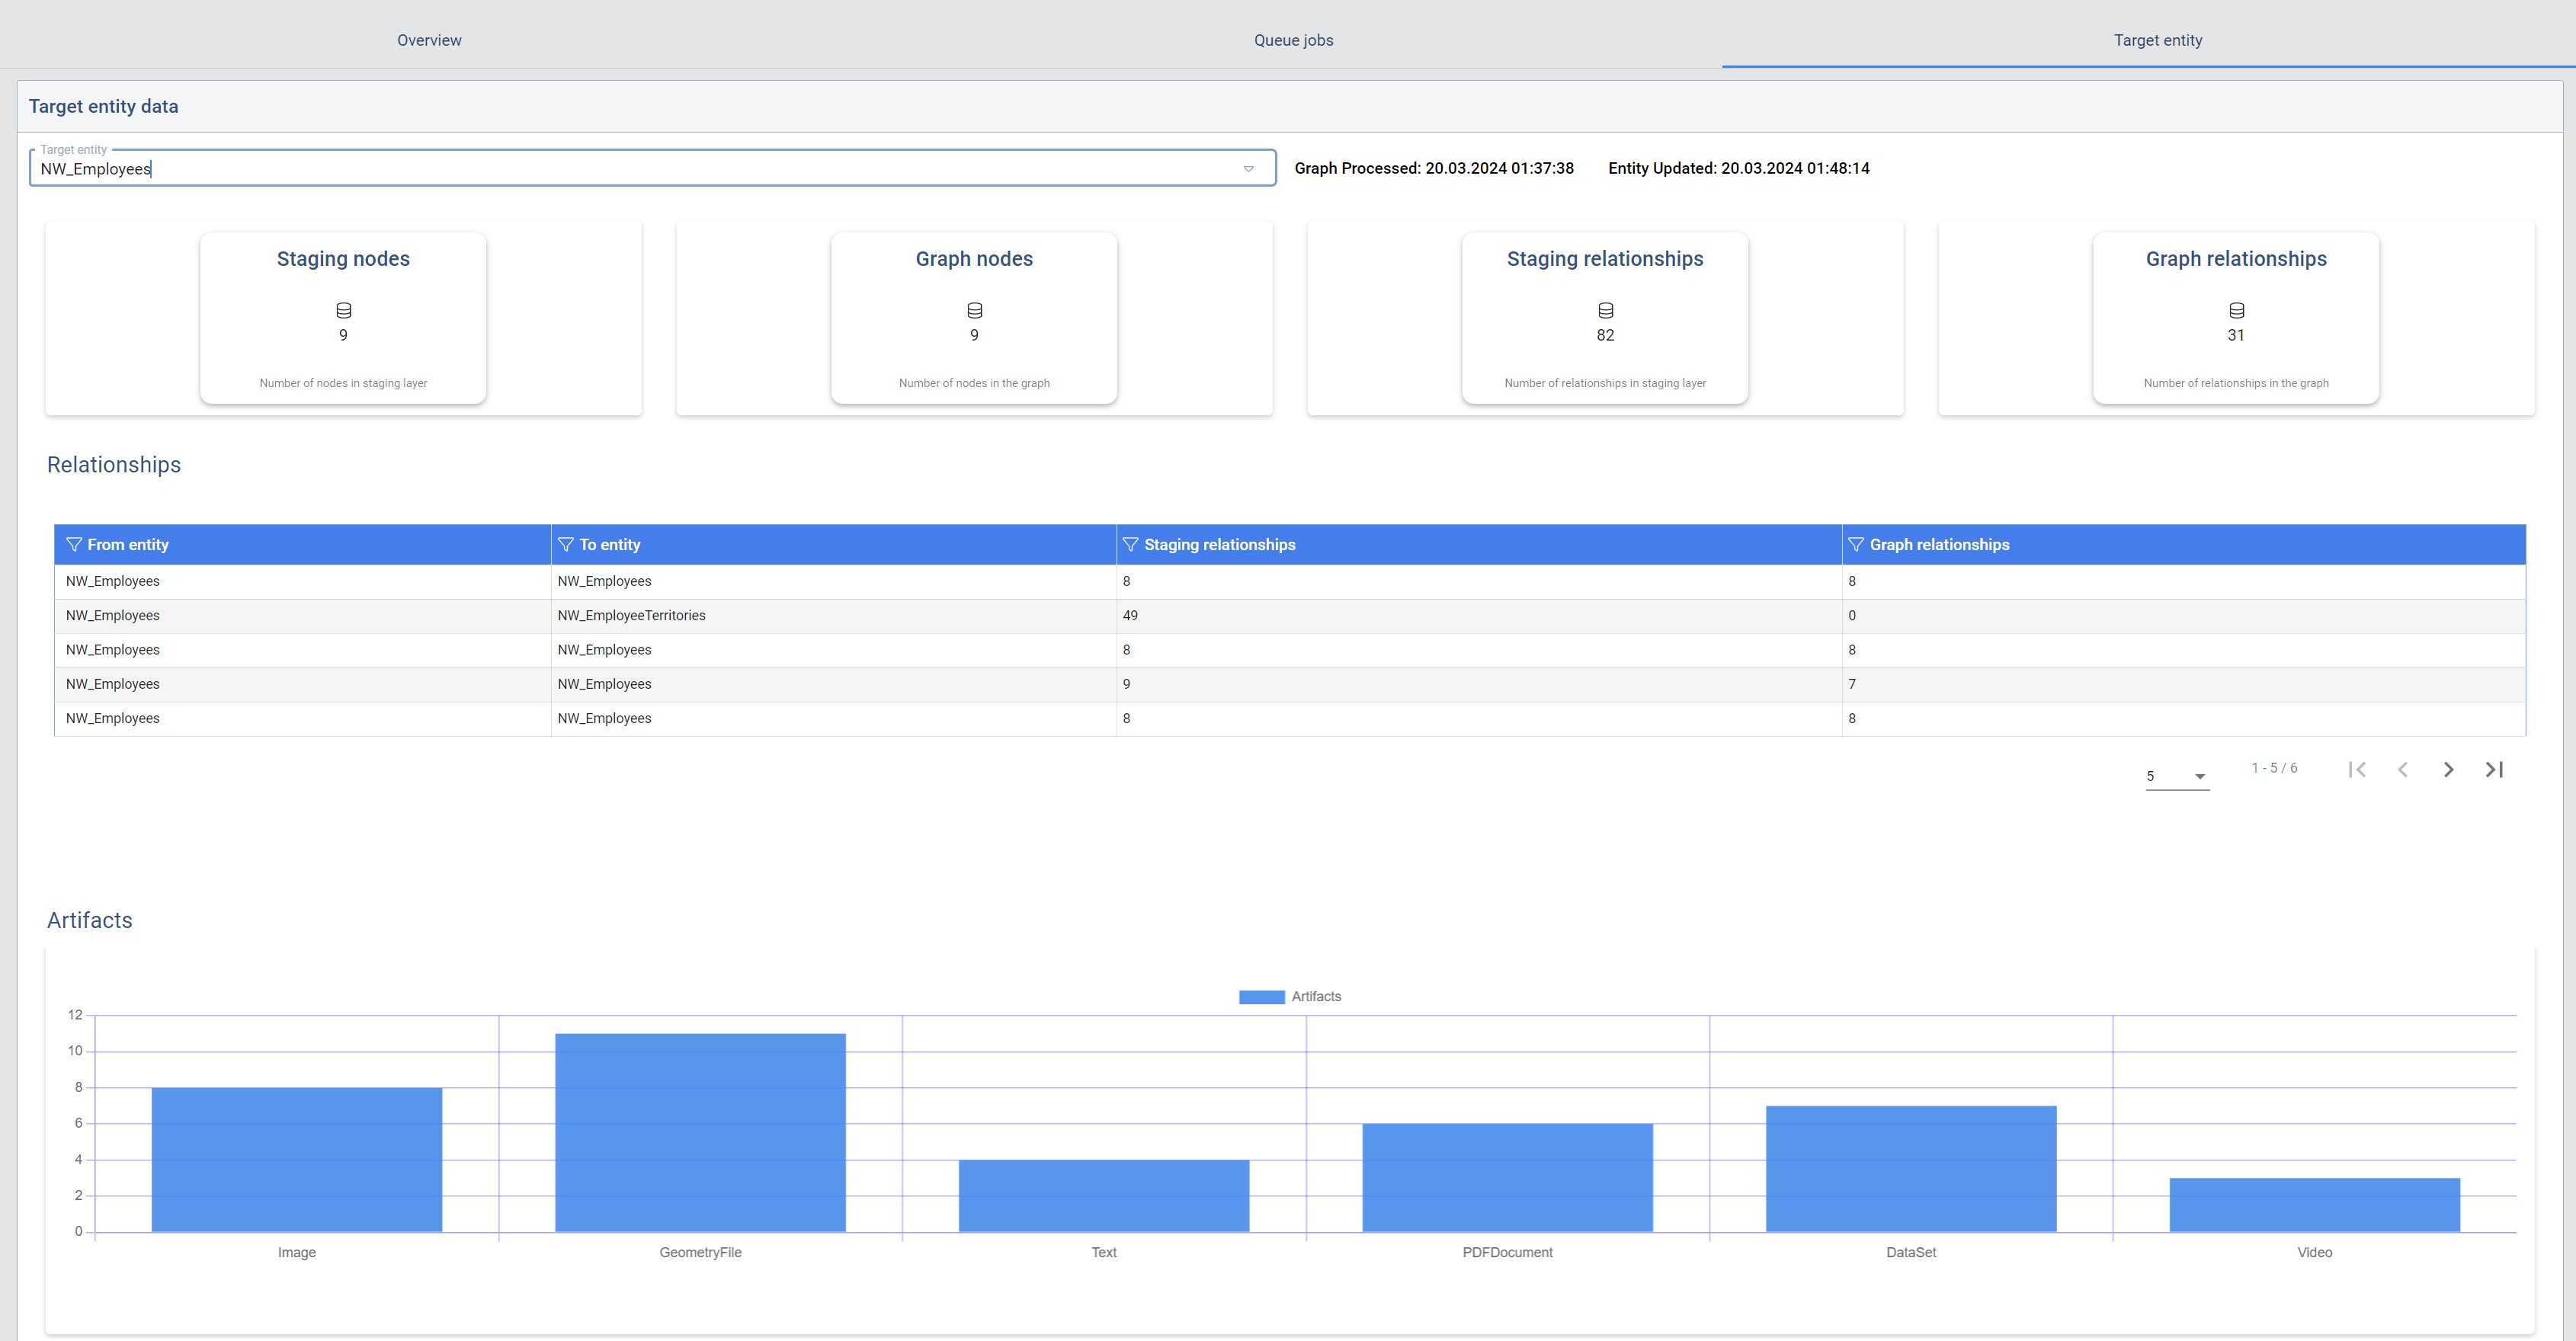
The user can select a Target Entity and take a look at the instances in the Staging Layer (Repository Node Count) and the amount of node saved in the graph (Graph Node Count). It is also possible to take a look at the type of Artifacts and the Relationships which are related to the selected Target Entity.